
Arteval Web app Design
A Saas based Web project where I helped design a B2B Dashboard for managing Art Submission and evaluation Process.
Dashboard
Wireframing
Development
UIdesign
The Real Problem faced by the NPO
COMPETITION FOR ART SHOW
The Social Network Art Competition (SNAC-expo) helps in finding and promoting exceptional undiscovered artists, through curated online art competitions and exhibitions globally.
ARTISTS COMPETE FOR A COVETED PLACE
Artists from around the globe submit images of their artwork on the website to participate in a competition. Each art competition is voted upon democratically through social networks and then expertly curated by two curating boards. The winners are then announced and their artworks are sold online.
THE MAJOR GOAL
Making the process of submission on the website intuitive for the artists who are from different backgrounds and age groups.
Making the process of Review convenient for the Administrators and the panel members.
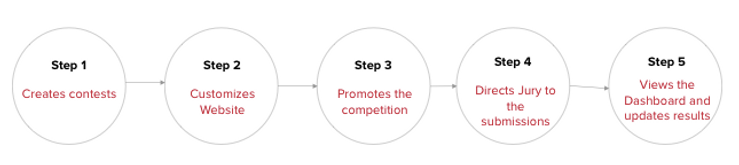
From Creation to Display - The Process
Artists create their profile on the website
Artists submit their artwork in a specific category
Voting of the artwork begins for a specific period
Best Artworks are selected by the dedicated Jury
Interested buyers can buy the artwork from the shopping platforms
Diving in Depth into the Problem
MY CONTRIBUTION
Analysis of the existing layout along with suggestions for improvement keeping in mind the results collected from user research.
Designed the mockups of the new Dashboard layout for the B2B.
Understanding the User stories and design a minimal solution keeping the non-technical nature of the users in mind.
THE DESIGN PROCESS
1. UNDERSTANDING THE VOICE OF THE USER
Collecting Requirements & User Stories
Defining User personas
4. WIREFRAMING THE INTERFACES
Sketching sample interfaces
Transforming the sketches to Low-fidelity wireframes
2. ANALYZING THE PROS AND CONS OF
COMPETITIVE APPS
Assessment of the existing Available apps
Listing of Feature set and Impact Map
5. LAYING OUT MOCKUPS
Defining the Styleguide
Creating High-Fidelity Screens
Checking the compliance with the reqs
3. ANALYZING THE NAVIGATION COMPONENTS
Identifying the Main and Sub Navigation Components using Affinity Mapping
6. DEVELOPING THE INTERFACES

Understanding the voice of the User
OVERALL GOALS
Creating a platform to unite worldwide artists and help them to earn recognition for their work of art.
Create functionality for Submissions, Evaluation and Voting process for future competitions.
Provide an overall view of the progress and profits made by each of the competitions and as a result, organize different competitions in different parts of the world
Enhance the functionality to update pages and marketing materials as easy as possible.
APPLICATION SPECIFIC GOALS
Ability to support multiple competitions for multiple organizations at the same time. (Including submissions and voting simultaneously. The app should provide the options to select the competition so that the Award Manager can work on specific sub-goals.
The app should provide functionality for Award Managers to approve, delete and edit submissions as needed.
The app should allow the Award Manager to select the Jury team and send the artwork for review.
Provide the ability for the Admin to create a specific competition Webpage or embed the art call to a promotion site
Allow the contestant to enter the competition by helping them register to the competition and submit the Artwork
The Web app must provide a dashboard with reporting capabilities to provide the Award Manager to view status, request reports of submissions and votes during competitions.
USER STORIES

PAINPOINTS OF THE USER
PERSONAS


Competitive Analysis of Apps

COMPARISON AND FINDINGS
Competitive Analysis helped us to synthesize information before jumping on to features and actual design. We did a comparative study of three Award Management Applications - Artcall.org, Judgify.me, AwardStage. For each of the selected competitors, we evaluated their process flow and Dashboard design
Analyzing the different apps, we found that Data visualization was the key aspect that was lacking and the process fell short in terms of minimalism and simple task flow. The onboarding process was not suited for non-technical users and the learning graph was steep.
On the good side, we found that all the apps supported the same target users and we also drew insights for framing our information architecture.
Feature Inventory and Impact Map
CUSTOMIZABLE FORMS
Each Submission and registration form must be customizable according to parameters of the competition
PAYMENT AND BILLING
The artwork selected from the competition must be made to display online and the buyers should be able to bid on the artpiece.
TRACKING USING ANALYTICS
To keep track of the visitors and the participants, there must be a way to incorporate analytics
VOTING AND SUBMISSION
Make the voting process easy and also give options for the competition owner to choose from different ways to vote for an art
QUICK SEARCH
Search criteria for both internal and external searches
WEBSITE AND BRANDING
The event manager must be able to create a webpage customized to the theme of the contest or simply able to embed the content on other promotional sites
IMPACT MAP

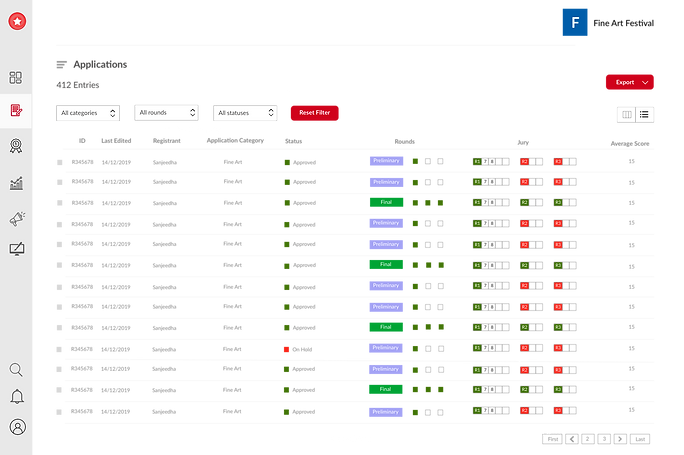
JUDGING PORTAL
Creating a portal for the judges and also a snapshot view for them to identify different evaluation schemes and history
VISUALIZATION OF DATA
A snapshot view of the statistics and analytics of the events, submissions & expenditure
MULTIPLE ROUNDS
Help the Event Manager create multiple rounds and assign jurors for the rounds for the art evaluation.
HELP AND DOCUMENTATION
Effective onboarding process and easy help functionalities to easy the learning curve
SOCIAL MEDIA INTEGRATION
Make social media a part of the voting and login process to recognize more artists
INTELLIGENT TAGS
Automatically generate tags for the artwork submitted in order to keep track of most submitted category
Placement & Design Layout
BRAINSTORMING
We used sticky notes to come up with features which needed to take a place on the Navigation - Step 1

AFFINITY MAPPING
Then, We organized the features listed based on Categories which defined the Primary Navigation - Step 2

CARD SORTING
Card Sorting help us to further refine the primary navigation on a granular level and define Secondary navigation - Step 3

Sketching and Wireframing the Sample Interfaces
DASHBOARD DISPLAYING DIFFERENT STATS


High Fidelity Screens
AWARD MANAGER FLOW
JUDGE FLOW


Future Enhancements
IMPACTS
It was well received by the CEO Guy Cohen of Social Network Art Competition and the team.
He also critiqued the dashboard saying it had all the elements and details required by the different target users and was a minimal design.
LEARNINGS
Dashboard Design
Working for different User Flows
Organization of Information Architecture
CARD SORTING
Include More Detailed Visualization
Design Dashboard for Jury
Work on Public Voting System and Result View